Financial Performance
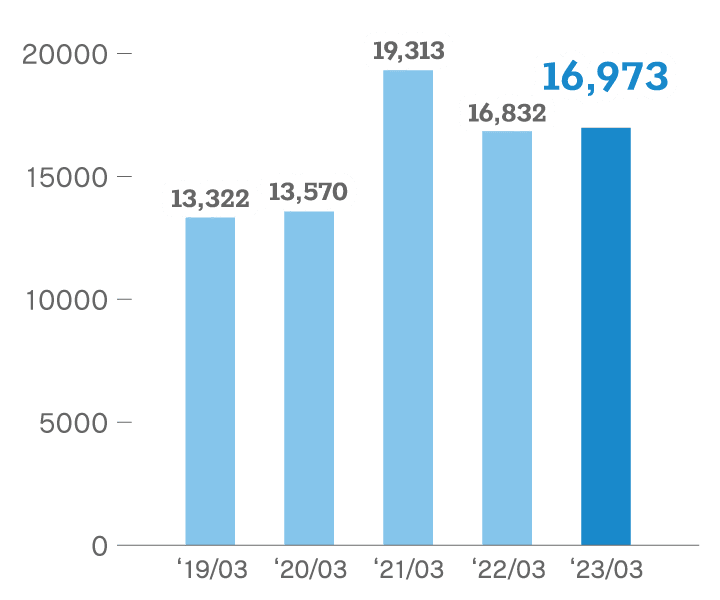
Net Sales
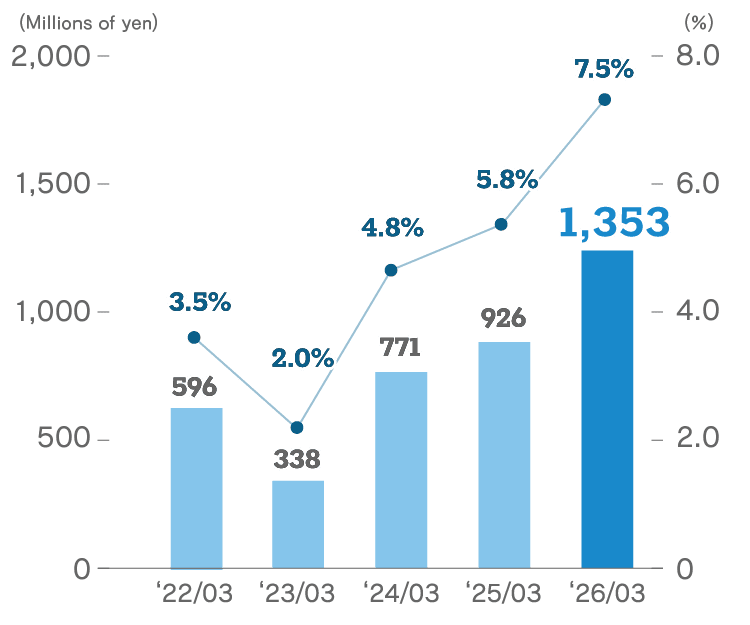
Operating Profit/Operating Profit Ratio
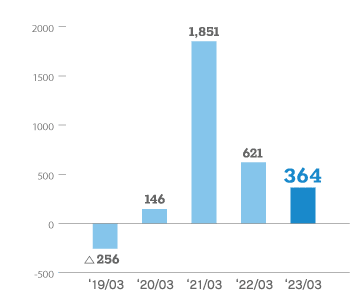
Ordinary Profit/Ordinary Profit Ratio
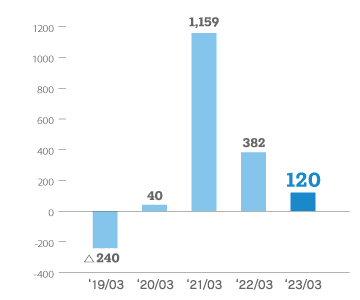
Profit/Profit Ratio
Profit per Share
Return on Equity
| FY2022 | FY2023 | FY2024 | FY2025 | FY2026 | |
|---|---|---|---|---|---|
Net Sales(Millions of yen)
|
16,832 | 16,973 | 16,063 | 15,935 | 18,129 |
Operating Profit(Millions of yen)
|
596 | 338 | 771 | 926 | 1,353 |
Operating Profit Ratio(%)
|
3.5 | 2.0 | 4.8 | 5.8 | 7.5 |
Ordinary Profit(Millions of yen)
|
621 | 364 | 790 | 938 | 1,366 |
Ordinary Profit Ratio(%)
|
3.7 | 2.1 | 4.9 | 5.9 | 7.5 |
Profit(Millions of yen)
|
382 | 120 | 394 | 591 | 884 |
Profit Ratio(%)
|
2.3 | 0.7 | 2.5 | 3.7 | 4.9 |
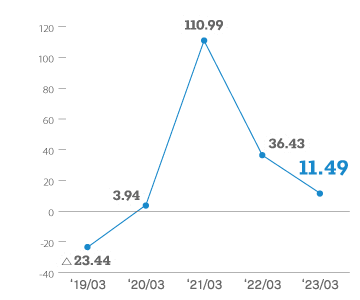
Profit per Share(Yen)
|
36.43 | 11.49 | 37.82 | 57.23 | 84.09 |
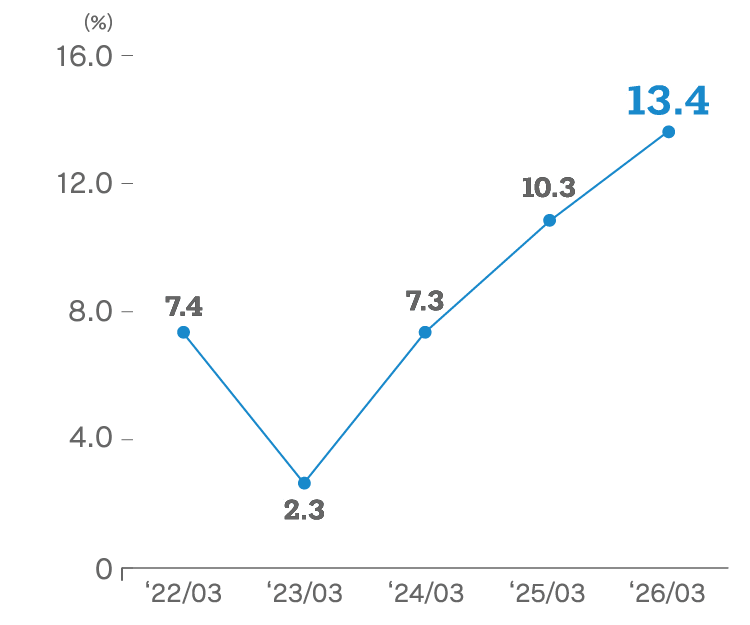
Return on Equity(%)
|
7.4 | 2.3 | 7.3 | 10.3 | 13.4 |
Financial Position
Total Assets
Net Assets
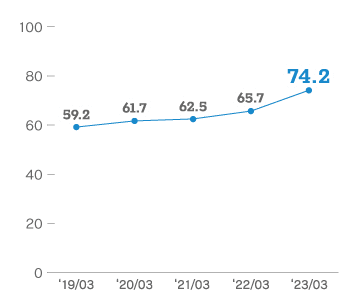
Equity Ratio
Net assets per share
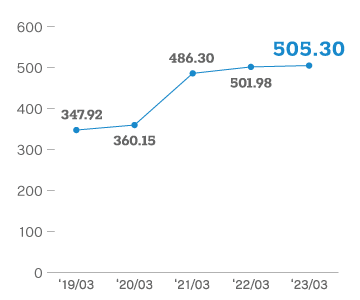
| FY2022 | FY2023 | FY2024 | FY2025 | FY2026 | |
|---|---|---|---|---|---|
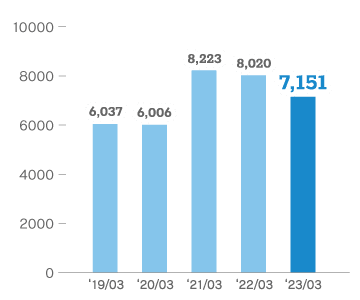
Total Assets(Millions of yen)
|
8,020 | 7,151 | 7,209 | 8,073 | 9,392 |
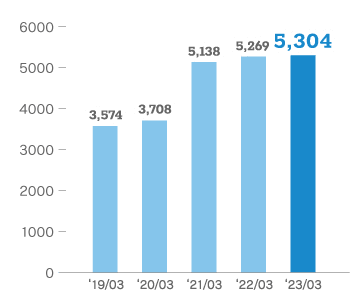
Net Assets(Millions of yen)
|
5,269 | 5,304 | 5,566 | 5,958 | 7,239 |
Equity Ratio(%)
|
65.7 | 74.2 | 77.2 | 73.8 | 77.1 |
Net assets per share(Yen)
|
501.98 | 505.30 | 538.56 | 579.51 | 680.90 |
Cash Flows
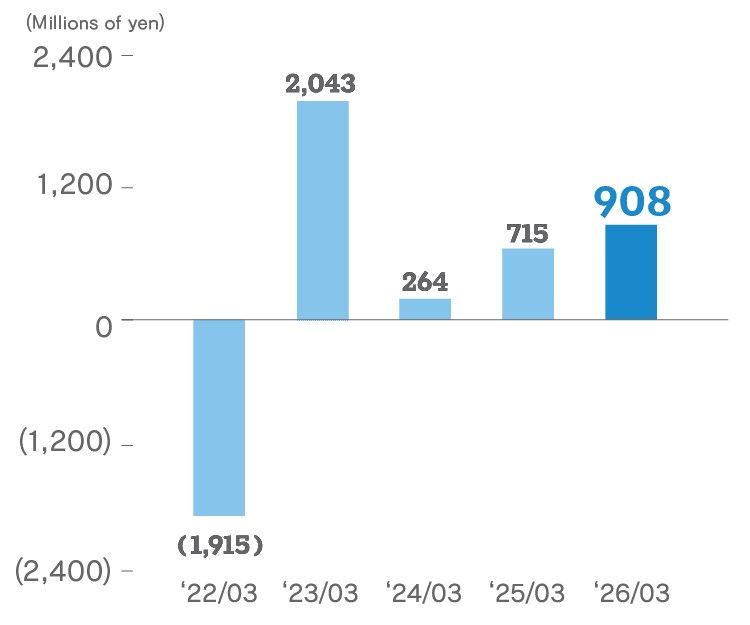
Cash Flows from Operating Activities
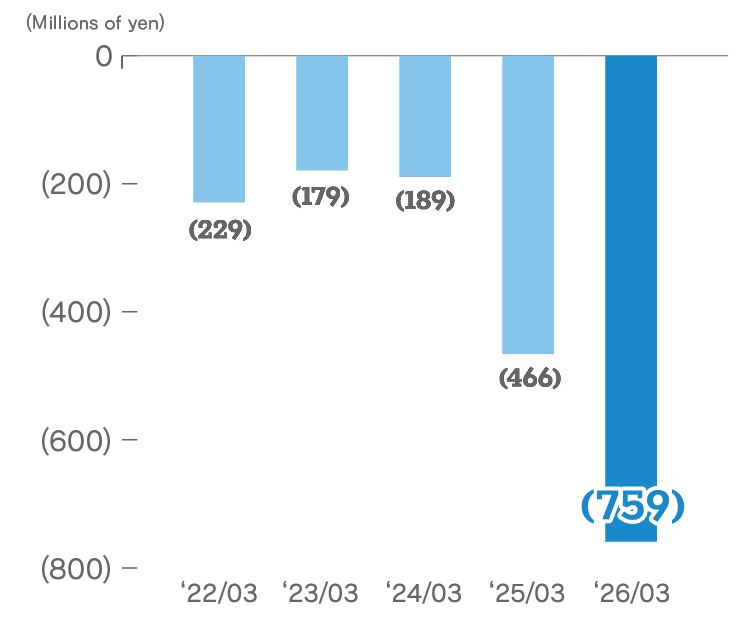
Cash Flows from Investing Activities
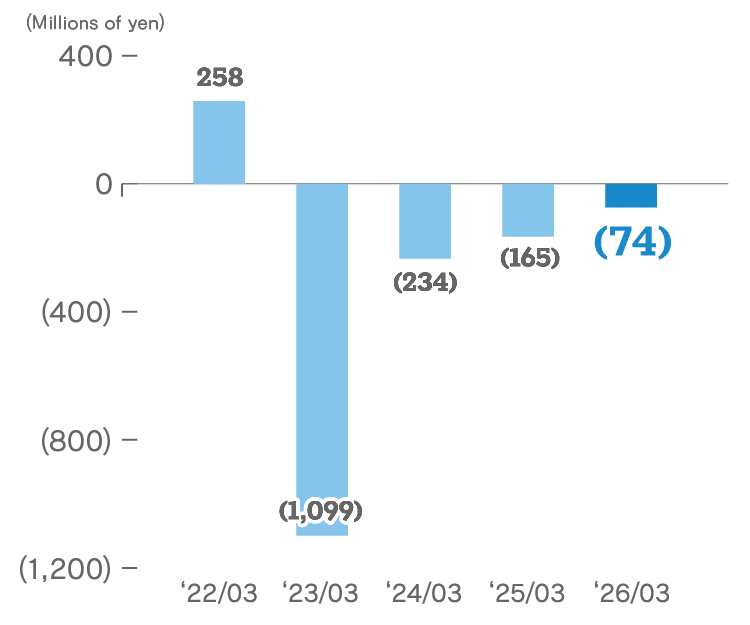
Cash Flows from Financing Activities
Cash and Cash Equivalents at End of Period
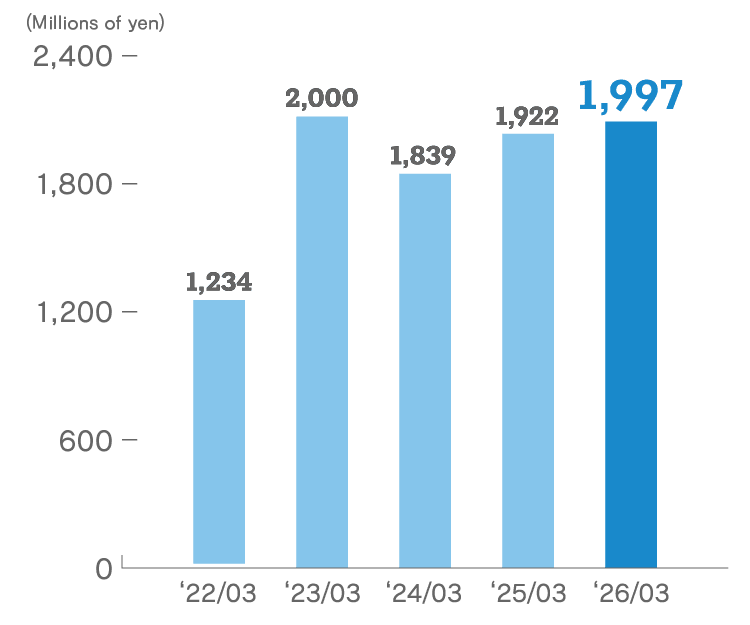
| FY2022 | FY2023 | FY2024 | FY2025 | FY2026 | |
|---|---|---|---|---|---|
Cash Flows from Operating Activities(Millions of yen)
|
(1,915) | 2,043 | 264 | 715 | 908 |
Cash Flows from Investing Activities(Millions of yen)
|
(229) | (179) | (189) | (466) | (759) |
Cash Flows from Financing Activities(Millions of yen)
|
258 | (1,099) | (234) | (165) | (74) |
Cash and Cash Equivalents at End of Period(Millions of yen)
|
1,234 | 2,000 | 1,839 | 1,922 | 1,997 |